Washington fans have had an uneasy last month or so as head coach Jedd Fisch has been thrown into coaching rumors as a potential target at both UCLA and Florida. It looks less likely that the Huskies will be going through a search for a new head coach today than it did before the Wisconsin loss but I decided to be proactive.
In order to help prepare for what has the potential to be the most hectic coach search season since the Oklahoma/LSU/USC/Notre Dame madness, I decided to build my own set of coach rankings to inform a dashboard to prepare me for the season.
You can find the link to that dashboard right here to follow along.
It’s intended to be viewed on a desktop so if you’re reading this on mobile, flag it and open it when you get back home. Here’s your user guide though for all of the features inside.
HEAD COACH RANKINGS
Let’s start with the good stuff that will either confirm your priors or make you think this is completely useless and get you to stop reading. Coach rankings.
My coach rankings include all FBS head coaches going back to 1951. I graded coaches on two axes which are averaged together to put together the total coach score used in the rankings.
The first part is the improvement score. For every season, I look at the 5-year history of a program and then compare the results to the 5-year average. If a coach exceeds the recent expectations then it contributes positively towards their improvement score. If the team gets worse than they have been recently then they get a negative grade. The improvement score is a combination of those comparisons over the course of their entire FBS head coaching career (note that I don’t have FCS or other lower levels included so Kalen DeBoer gets no credit here for Sioux Falls).
The second part is the success score. This is expectations be damned. If a coach’s team is really good then they finish well in success score. If they take a team in the Sun Belt to be the #30 team in the country then they still aren’t going to have a better success score than the preseason #5 coach who relatively laid an egg to finish 29th despite having an NIL budget 20x bigger.
Now that we have some context, here are the top 23 current coaches in the rankings (because that’s what fits on the screen when grabbing the image).
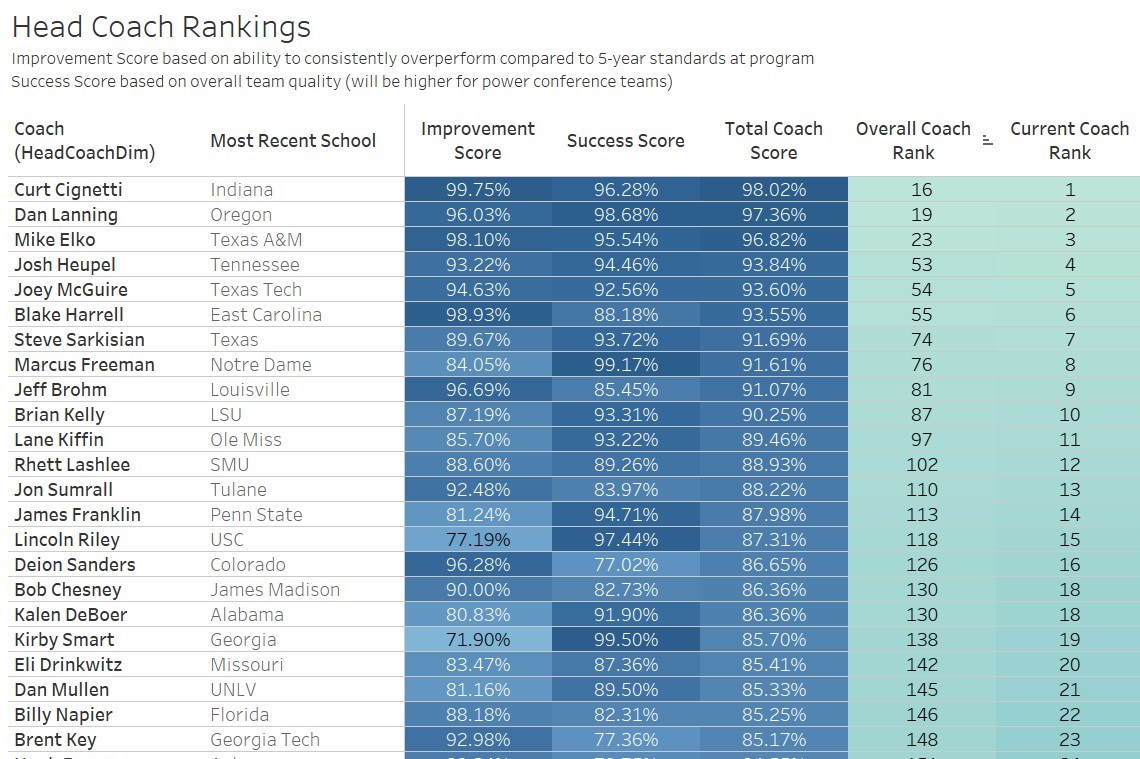
You’ll notice that several of these coaches have already been fired this cycle (#10 Brian Kelly, #14 James Franklin, #22 Billy Napier, and #24 Hugh Freeze). Not a great start. Although James Franklin also has already become the first coach to be hired this cycle as well for what it’s worth.
These rankings take into account the entirety of a coach’s career and aren’t weighted towards more recent seasons. If you’re great for the first seven years of your career then have two bad seasons, you can still get got. Everyone on this list has multiple seasons of either turning a terrible program into at least a good one or leading a top 20 caliber program even if it didn’t translate to big wins at a blue blood.
Four of the top five coaches right now have teams that are extremely well-positioned to make the College Football Playoff and #1 and #3 have already signed extensions to keep them out of the coaching market this cycle. Jeff Brohm at Louisville (#9), Lane Kiffin at Ole Miss (#11), and Jon Sumrall at Tulane (#13) are considered to be the hottest names as targets this cycle followed closely by Bob Chesney at James Madison (#18) and Eli Drinkwitz at Missouri (#20).
For those interested in the Washington of it all, let’s talk about Jedd Fisch. We have to scroll down a little bit to find Fisch’s name but not too far. Here are spots 35 through 41 among current FBS head coaches for you: 35. Bret Bielema, Illinois (80.6%), 36. Jason Eck, New Mexico (80.4%), 37. Jim Mora, UConn (80.3%), 38. Willie Fritz, Houston (78.8%), 39. Jedd Fisch, Washington (78.7%), 40. Lance Leipold, Kansas (78.4%), 41. Dabo Swinney, Clemson (77.8%).
More specifically, Fisch has an improvement score of 82.9% and a success score of 74.5%. The job Fisch did at Arizona went from below program standards his first year to way above them by year 3. It looks like he’s on a similar trajectory at Washington with year 1 a bit underwhelming (circumstances obviously weren’t in his favor) but back above average by year 2 this season.
The names around him are mostly made up of coaches who have found early success at programs with historical standards below Washington which means higher improvement scores but lower success scores…Except for Dabo Swinney who has a 97.3% success score but a 58.3% improvement score. Swinney obviously took Clemson to the absolute top of the sport but then has also been the coach as they’ve quickly fallen from that mountain’s peak. Which part should be considered more important or should they get equal weight? Right now it’s all factored in but by next year I’ll re-evaluate if I should make adjustments for coaches who have been coaching at the same spot 10+ years because they’re just being compared to the standard they’ve already set.
Coaching Heat
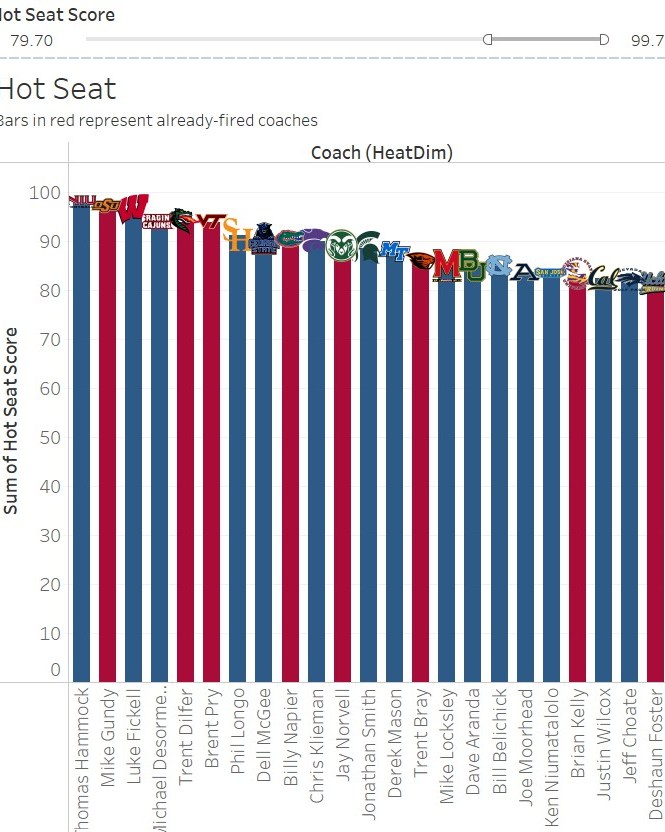
This tab has two components: the hot seat score and the hot target score. Those should be fairly self-explanatory. I put a formula into place to try to judge which coaches are under the most pressure for their job on a scale of 0-100. It’s not absolutely perfect but you’ll see that just about every coach fired is present in the below image looking at the top 20 or so across the sport with those in red representing the already-fired. The one exception is James Franklin at Penn State who was fired almost exclusively because of national championship expectations rather than deserving it based on the totality of his resume.
Wisconsin’s Luke Fickell has already received a vote of confidence from his AD that he’ll return next year but the hot seat formula says watch out for Michigan State’s Jonathan Smith even though he’s just in year 2. Kansas State’s Chris Klieman probably enters next year on the hot seat instead of truly being on it this year and Baylor’s Dave Aranda would be in serious trouble except his AD just stepped down in scandal so there may not be any one with the authority to fire him still in 2 weeks.
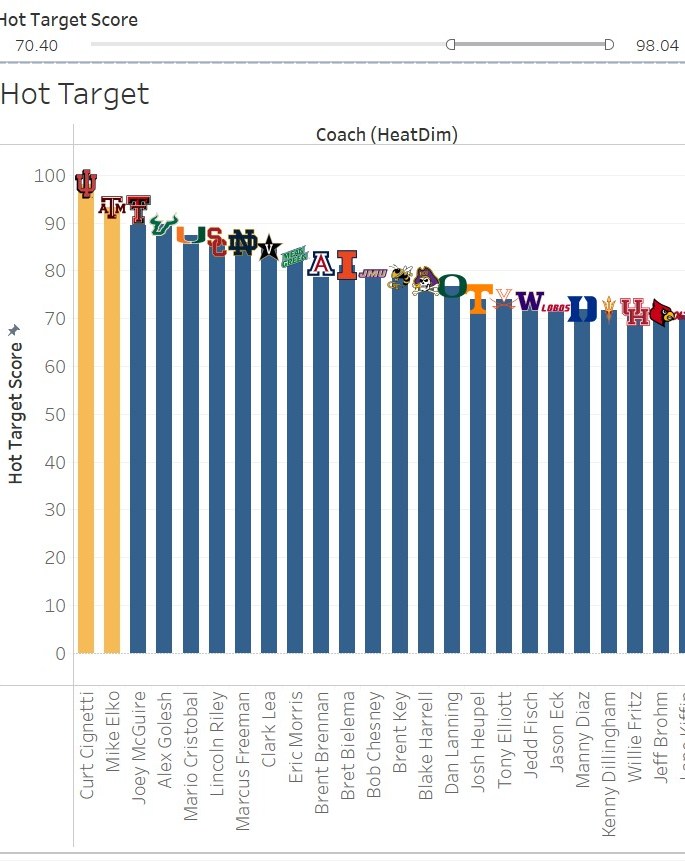
The flip side of the coin is the hot target list. The same general idea applies to this part except it’s designed to look for the coaches who are likely to be in the most demand based strictly on their resume. The ones in yellow are coaches that have signed an extension to take them off the market which includes the top two options Curt Cignetti and Mike Elko.
Beyond that there are several names on this list who have been bandied about for top jobs. That includes Alex Golesh at South Florida (#4), Clark Lea at Vanderbilt (#8), Jon Sumrall at Tulane (#9), Bob Chesney at James Madison (#12), and Brent Key at Georgia Tech (#13). The re-sizing that this format does may have cut off the very edge but the man everyone wants (Lane Kiffin) is at #24 here with popular target Jeff Brohm of Louisville just ahead of him. That’s mainly because the advanced team stats have this year’s Ole Miss team behind last year’s even though this year’s squad is set to make the CFP and last year’s just missed due to a few stupid late losses. Being viewed as on the upswing is a key piece of the formula for this component.
JOB PERFORMANCE
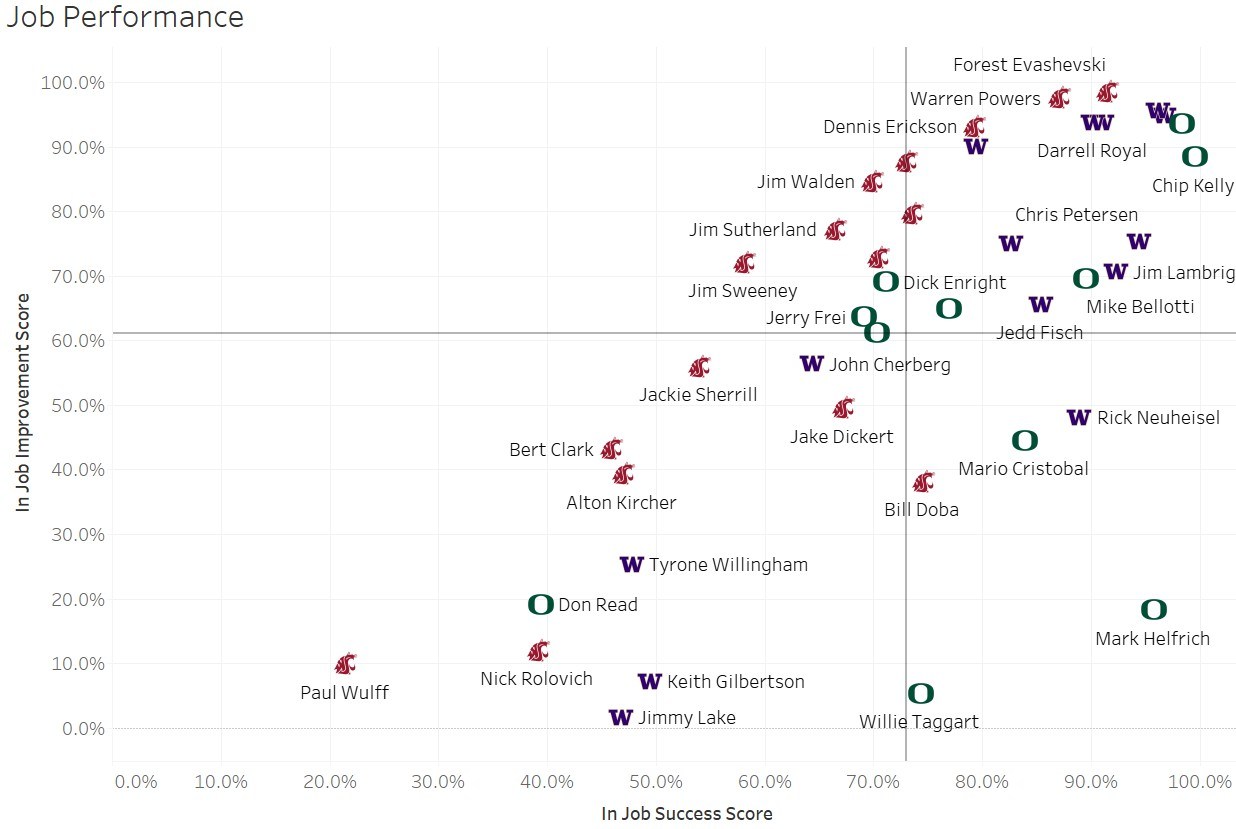
This one is less relevant for a current coaching search but those who love their college football history can waste a lot of time playing around with this view. For the preview below I selected Washington, Oregon, and Washington State just for fun. The job performance view shows every FBS head coach since 1951 and their improvement and success scores just for each individual coaching tenure. So by selecting a single team, you can see which coaches performed the best throughout that team’s post-WWII history.
You can see a couple of interesting clusters for the Huskies. Longevity isn’t specifically taken into account in this view but in almost identical W’s in the top right of the graph we see Kalen DeBoer and Don James. Obviously, one of those men has a statue outside the stadium and I’m going to take a wild guess to say that the other won’t by the time it’s all said and done.
There’s another pair of W’s just to their left which is Howard Odell and Darrell Royal, both from the 1950s. It’s a little hard to tell from the way Tableau does the labelling but Chris Petersen is the W almost directly down from the DeBoer/James duo while the one to the left of Petersen is Jim Owens. UW’s current head coach Jedd Fisch just barely makes it into the upper right grouping.
It’s unfortunate for Husky fans that right next to that DeBoer/James pairing is an Oregon O that represents Dan Lanning. Attribute whatever proportion of his success to Lanning or to Phil Knight’s NIL but Lanning has had Oregon performing at a level as good during his tenure as any PNW team since 1951.
On the bottom portion of the graph, I’m sure many Husky fans expected to see Tyrone Willingham in the far bottom left. The standards of the program had been lowered a bit by the Gilbertson tenure which helped Willingham’s improvement score and his first few years (while certainly bad) weren’t as atrocious as the winless season that eventually came. And so Paul Wulff stands alone in the bottom left despite getting the Crapple cup win that year.
CURRENT FBS COACHING RESUME
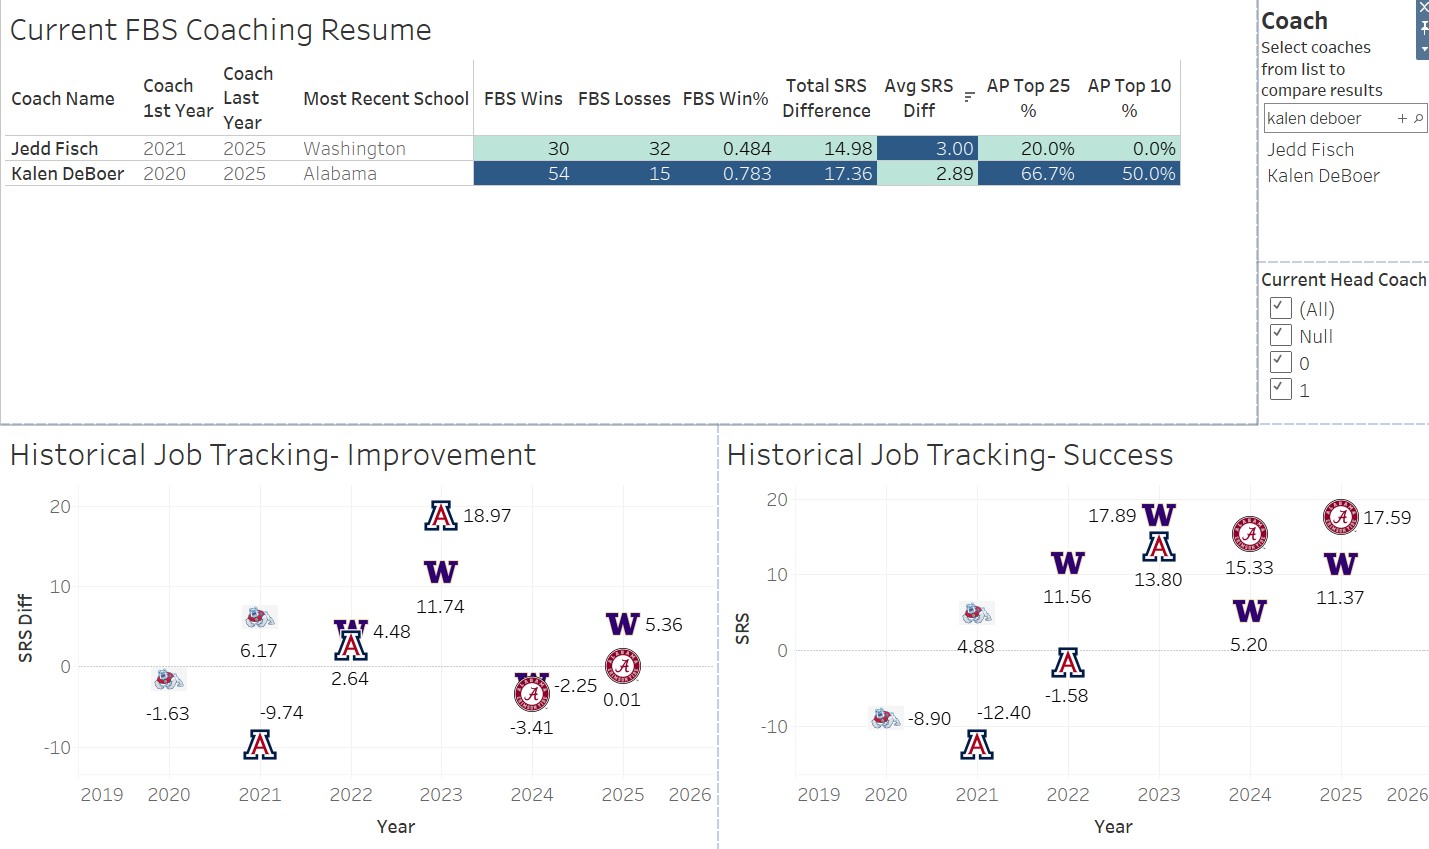
Interested in what a coach’s resume looks like right now and how he has performed in improvement and success score from a year-to-year basis? This is the tab for you. You can choose to look at all coaches, or can put together your custom list of coaches to see how they have fared compared to one another (particularly useful if putting together your wish list for a next head coach).
The win percentage and AP Poll parts of the table are self-explanatory. The Total and Avg SRS Difference portions are the components that go into the improvement score. The total is a cumulative amount so the longer a coach has been tenured (and good) then the higher that total is going to be. The average of course looks at it as an efficiency total. So below we can see that Jedd Fisch has a lower SRS difference which makes sense since he has been a head coach for one fewer season but has a slightly higher average number.
Below the table are the improvement and success scores they each had on a year-to-year basis. Back in 2023 Jedd Fisch had the higher improvement score getting Arizona to be a 10 win program given the ground zero they started from compared to Kalen DeBoer taking what had been a talented team and getting them to the national title game. But DeBoer had the better success score that year as he has for all 5 seasons they’ve both been a head coach which shows up in the wins/AP finishes.
COORDINATOR RANKINGS
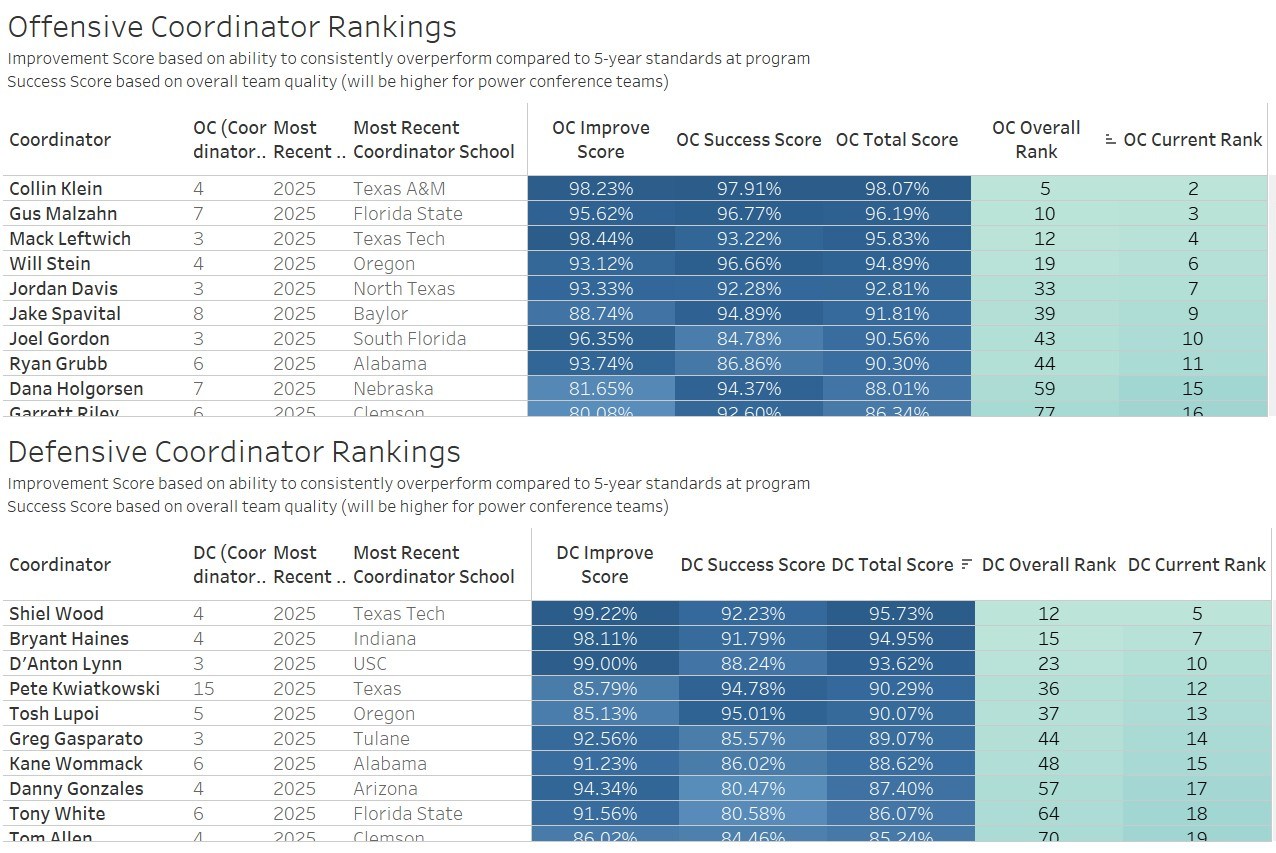
In addition to the head coach rankings we also have the offensive and defensive coordinator rankings. The criteria for the coordinators’ improvement and success scores are the same as they are for the head coach except just focused on each side of the ball.
The data for each of these isn’t as complete as they are for the head coaches. The idea of having an offensive/defensive coordinator is more modern than an overall head coach and some coaches serve as the de facto coordinator on their side of the ball. If a program names a specific coordinator then I include that coordinator even if they don’t have play calling duties (such as UW with Jedd Fisch and his OCs). If there are co-coordinators listed then I did my best to determine which one is considered primary with a bias towards coordinators that end up becoming head coaches.
Below are the top finishers among current OCs/DCs who have been in a coordinator role for at least 3 years (which is filterable on the side). On the offensive side, Texas A&M’s Collin Klein and Oregon’s Will Stein have gotten the most buzz as potential head coach candidates this cycle. Texas Tech’s Shiel Wood and Alabama’s Kane Wommack seem to have gotten the most buzz so far on the defensive side.
Both of Washington’s coordinators have fallen generally in the upper-middle. Jimmy Dougherty (who has been named a candidate at Colorado State) is 54th among current OCs with an 84.2% improvement score and 57.1% success score. Ryan Walters ranks a little higher at 40th among current DCs with a 75.1% improvement score and 77.6% success score.
CURRENT SCHOOL TARGETS
We’re down to the final one!
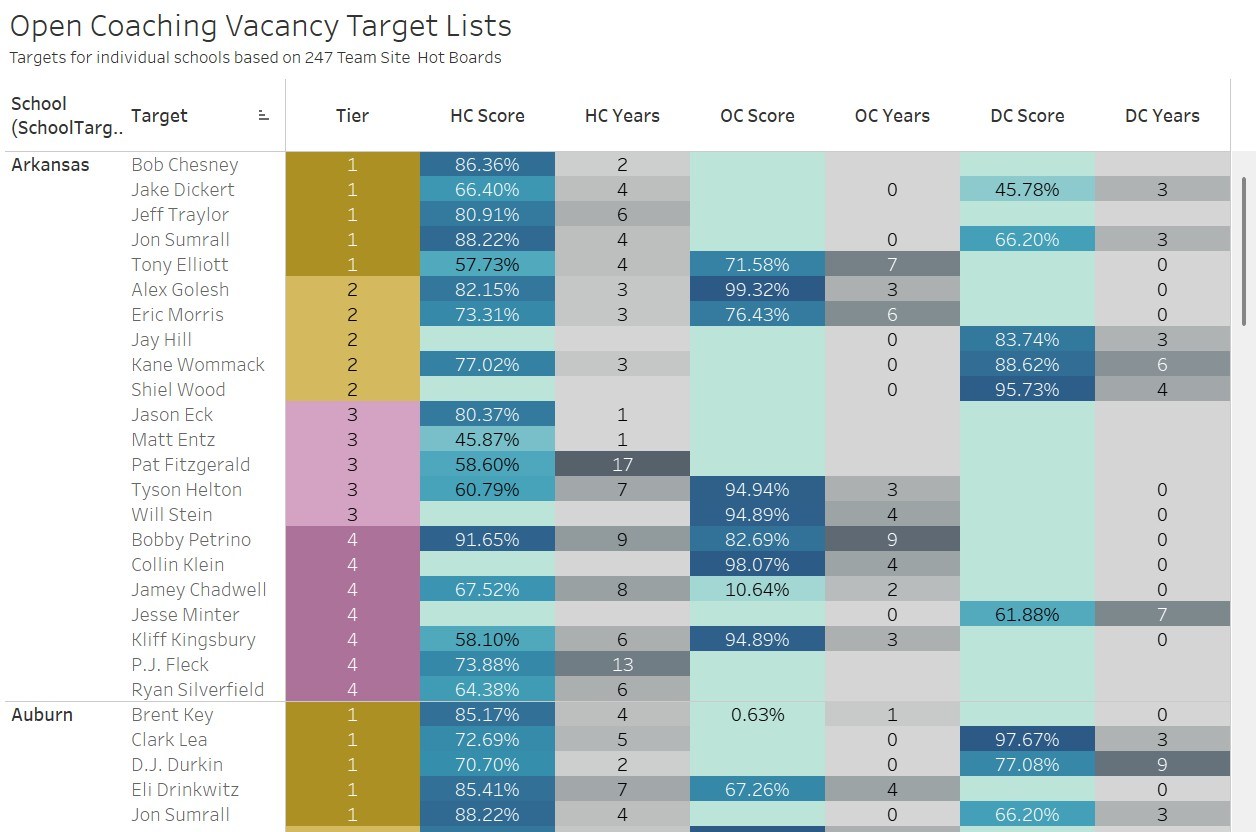
This is the one that takes the most work to update so we’ll so how strenuously I keep it up-to-date over the coming weeks and into the future. I’ve tried to look through the 247 Sports hot boards on each of the team sites involved in a coaching search to run through their list of candidates so you can compare them all in one place. I tried to divide the tiers based on how those sites talk about the likelihood of the candidates. Although it can be hard since some schools may be going after a candidate very aggressively even if there’s a small chance they get the job. I decided to put a maximum of 5 schools in Tier 1 and Tier 2 but allowed for a long tail of Tier 3 and Tier 4 if there are just a ton of names that have been thrown out.
You can see at the top for Arkansas here which their site has said is down to a final list of 8 targets with a thought that they are primarily pursuing a head coach with a DC background to pair with a hot shot OC. The view below shows you their overall head coach score and coordinator score at the FBS level along with their tenures in each role.
*****
Thanks for reading and let me know if there are features you love or would like to see added. I appreciate the feedback. For those on desktop, here is the embedded version of the dashboard (although I recommend going to this link though, it looks better in a separate tab than as part of the article).